How to Define a problem using the Six Sigma approach? is the continuation of the Let's Win Gold in Olympics case study that the author thought of as he maneuvered his car through busy roads, a thought crossed his mind, “I can win Gold in the Olympics, I am already competing in the Olympics of the company’s survival in a competitive global marketplace. It is a Global event; every country is fighting hard to win significant business market share in its segment. He says, World recognizes the one who strikes Gold, as we don’t remember who landed second on the moon. Let us commit ourselves and make a beginning together today the very moment. We don’t have to necessarily be in the army or a sports village to take part in the Olympics. Global Business World is our Games village, and we are already competing with other countries in our business segment. Let’s realize this reality and journey together, let’s win Gold in the Olympics.
Define the Business Case
A Business case describes why this problem is important to Business you may lose the client account if you don’t solve this problem if you don’t solve this problem, you may lose the client account.
Example: The company is losing Rs.1,80,000/- every month for not achieving an accuracy slab of 98%. Losing revenue is an opportunity loss for the company, while not reaching the premium accuracy slab may cause client dissatisfaction.
Define the Problem Statement
Describe the problem faced preferably in numbers. For instance, a problem could be with meeting TAT (Turn Around Time) or Accuracy % inconsistently. When you state a problem remember, not to state solutions alongside. If you know the solution, it is no longer a problem.
Example: Accuracy % is below 90%, leading to a loss in revenue loss of Rs.1,80,000/- every month.
Define the Goal Statement
Now that you know the problem, what is the goal? Describe the target to achieve with timelines. For instance, lessen the average turnaround time from 14 hours to 10 hours by the week ending March 2016. Another example could be, an increase client client-reported accuracy % from 88% to a minimum of 97% by the week ending April 2016.
Example: Improve Accuracy % from below 90% to 98% or above by the week ending October 2016.
Define the primary and secondary success measures.
A primary success measure directly impacts the goal of a project. For instance, to achieve a higher accuracy percentage, file turnaround
time shouldn’t change. So, we can say accuracy % is the primary success measure, while turnaround time is a secondary success measure.
Example: Primary Success measure is; secondary success measure is Turn Around Time compliance %.
Define the financial and customer benefits of solving the problem
Specify the benefits of solving the problem for business and customers. Specify the Business benefit as monetary gain to the company, while customer benefits could be an increase in satisfaction levels or other relevant measures that the customer is keen to see.
Example: Annualized savings of Rs.21.6 Lakh rupees to the company. Achieving an accuracy percentage of 97% or above will impact customer satisfaction levels.
Define the constraints
Seeing constraints even before you start solving a problem is not uncommon. Bring them up and discuss them with stakeholders. A constraint can be anything; you should keep them in mind during solution design. For instance, it can be a budget, technology constraints, geography, etc.
Example: “Achieve solution to the problem within existing technology and resources.
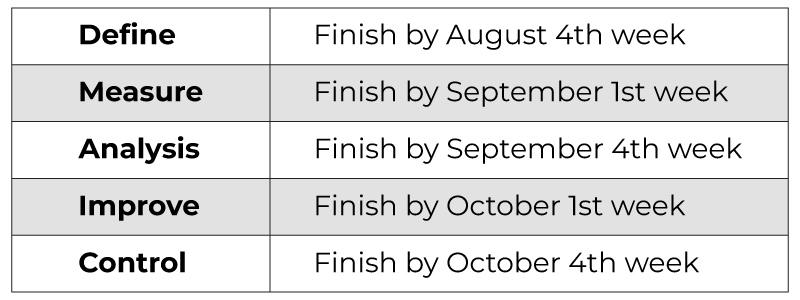
Define problem-solving timelines
Well, this is a tough one if you don’t have problem-solving experience and skills.
However, don’t worry, we will use a rule of thumb. If the problem is not complex you should aim to solve it between 8 to 12 weeks.
Example: Project timelines.
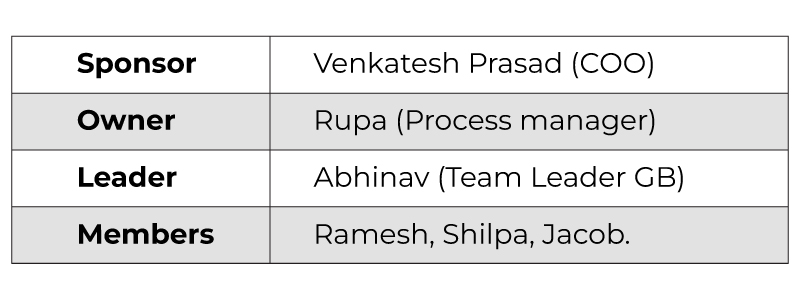
Define the team structure.
In the Six Sigma approach, a Project sponsor is a must. A sponsor is a senior management representative who sanctions time and resources for problem-solving efforts. A sponsor can be a senior management representative or a Manager of the process in scope for problem-solving. A Project Leader is required to lead the problem-solving effort with other team members. Choose Team members from the impacted area. A project leader can be a Six problem-solving-Sigma black belt or a green belt.
Example: Team
A problem well-defined is a problem half solved, and it is true. If you put effort into defining a problem before solving it, you are putting in effort to master it over time. As you progress and practice ‘defining’ a problem before solving it, you will realize over time, how important it is to do so.
Summarize the findings of the defining phase in just one page. This one-page document is called a ‘project charter’ in Six Sigma.
How to Measure the current state?
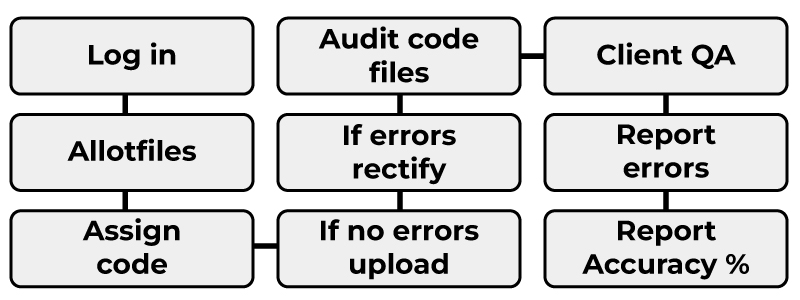
Measure the current state of the process flow.
Any process has three versions. What someone thinks it is, what it is, and what it should be. Let me explain, someone is preparing tea in the kitchen for you, you know the steps in sequence. You don’t know what is truly followed until you directly see going there. The first version is, ‘what you think it is, and the second version is truly followed. To know the true version, you should directly see the process as it takes place. When you wish to map the current state of any process, go to the place where it takes place and see for yourself.
Example: Process flow diagram.
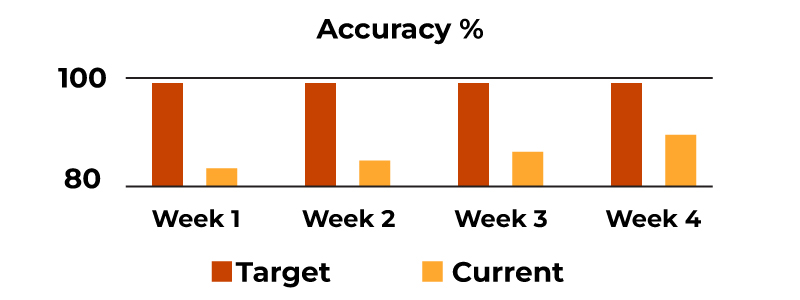
Measure the current state of primary success measure
A picture speaks a thousand words goes an old saying. It is a fact. Use a simple line graph or a bar graph to show the current performance of the primary success measure of your project.
In our example, the primary measure is accuracy %.
Example: Bar chart
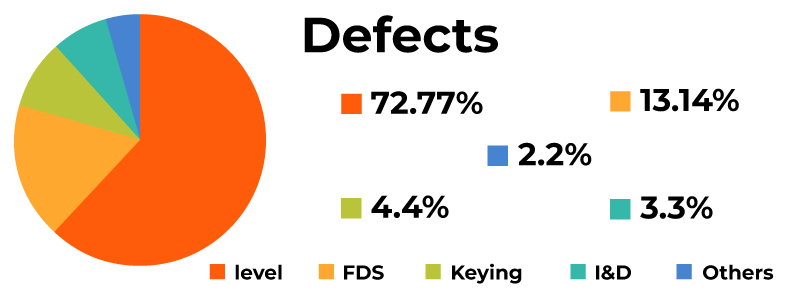
Measure the current state of the type of defects.
Defects appear again if they are not eliminated. The type and frequency of defects don’t change until they are resolved. Use a simple Pie chart to show the type of defects you are getting the most. Is there a pattern, or is there a trend?
Example: 77% of defects are related to Level.
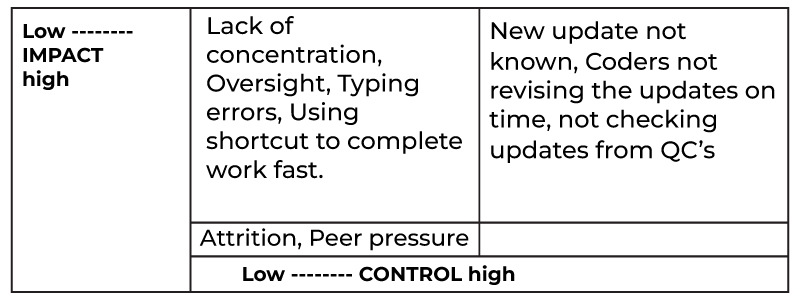
Measure the current state of controllable causes.
After you know the various types of defects, it is time to ask a key question – are the causes in your span of control? If you find root causes to those causes and carry out solutions, will they impact the accuracy %? Use a simple control–impact matrix to find answers. Along the X axis control (something you can influence) varies from Low to high. In the Y axis, the impact varies from low to high, it is the impact on accuracy %, the primary success measure.
Example: Control vs. Impact matrix.
How to Analyze for root causes?
There are many statistical and non-statistical tools to find the root causes of a problem. The most effective tool to date is the five why analysis. It is a simple tool, but difficult to master without practice and use. To explain five why analysis let me consider a few examples.
Example 1: Defect: Wrong HPI entered: Wrong code used: 99283 used instead of 99285.
Why 99283 was used instead of 99285?
Did not read the document completely.
Why did not read the document completely?
“I looked at the size of the paragraph and thought all the elements would be there.”
Why assume all the elements are there based on the size of the paragraph? Used my experience from the past.
Root cause: The Associate assumes the number of elements by looking at the size of the paragraph.
Example 2: Defect: Wrong HPI entered: Wrong code used: 99283 used instead of 99285.
Why 99283 was used instead of 99285?
“I wasn’t sure where to take the HPI element from the document”.
Why you don’t know where to pick it from?
“Looked in the physician record and not aware that it can also be located in the nursing record”
Why are you not aware that it can be located in the nursing record?
“Did not come across such scenario in 3 months of coding, got the information from physician template itself.”
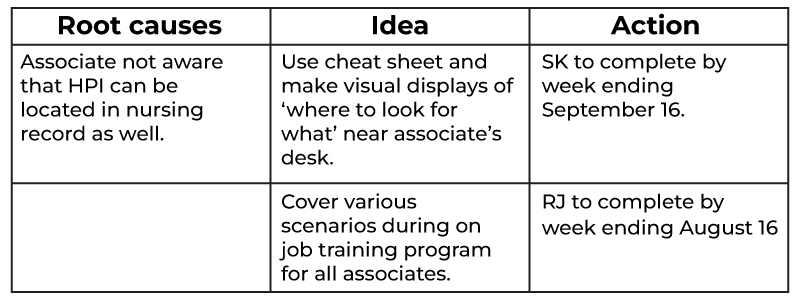
Root cause: The associate is not aware that HPI can be located in the nursing record as well.
Example 3: Defect - I & D coded as simple instead of complex repair.
Why, was I&D coded as simple instead of complex repair?
Missed looking into the packing documented in the procedure note.
Why you did not read the document completely?
The document was read and identified as simple but missed the gauze packing to code complex.
Why did you miss it? I don’t know.
Root cause: To read and hold ‘what is read and inferred’ in the mind using the visual method is an unreliable method.
By now I hope you have understood what is ‘five why analysis’, it is a technique of asking ‘why a repeated number of times’, till you discover the root cause of a certain incident. It is like peeling the layers of onion, till you get to the core.There are various statistical tools to discover the root causes of a problem. For instance, many believe higher the skill level better the accuracy of the associate. A scatter plot can test this theory.
Example: Scatter plot. A team plotted accuracy achieved for the month by associates skill level using a scatter plot and here is what they see.
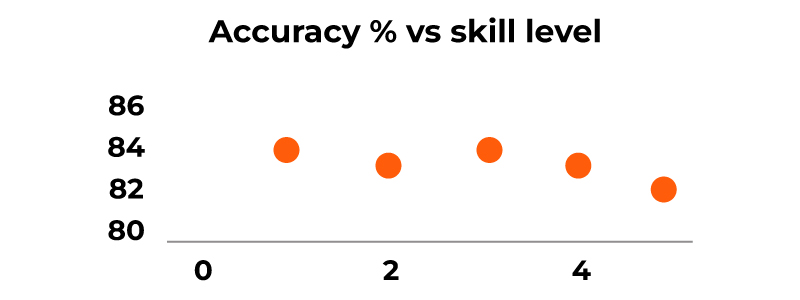
On the X axis – The skill level varies from 1 (low) to 5 (high). On the Y axis – Accuracy % is plotted. It is interesting to see as the skill levels are going up, the accuracy % is reducing! Use statistics to test your beliefs.
How to improve a process?
There is only one way and technique to improve any process. It is to set up solutions or take action. Keep it simple root cause, idea, action.
Example: Idea implementation action table.
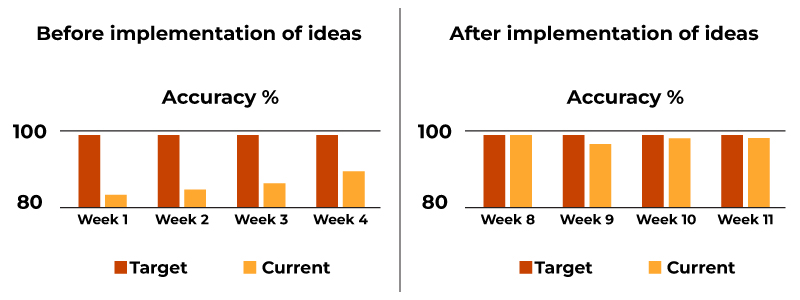
To discover and develop is half the story. The other half is to complete them and see if the accuracy % improves, if it does, you hit the hammer on the nail, if it doesn’t, you need to relook at the root causes, the ideas, and the implementation rigor. Example: A comparison of before and after implementation using a simple graph.
How to control a process?
It in other words means, how to keep the gains? This is the most crucial part of any improvement story. More than 70% of improvement stories fail here. Discipline is a must to keep the gains. Here are the key points that will work to keep the gains.
-
Review accuracy % every day.
-
Collect, consolidate, and review the type and frequency of defects every day. Don’t procrastinate, no matter how busy you are.
-
Train everyone on five why analysis, and do five why analysis every day. Knowledge of five why analysis is gained only by regular practice.
-
Find root causes every day, if they were the same as before, find out, what wasn’t followed as intended, and reinforce adherence to the laid down new procedures. If you discover new root causes, brainstorm and gather new implementation ideas, and complete them in time time-bound manner.
-
Check results ‘before-after’ after implementation to ensure, the fulfilled idea works.
-
Reward and recognize significant contributors.
-
Keep a close watch on accuracy % target vs. actual values week on week. Intensify, set priorities, and attack as soon as the trend goes down. The more you delay, the worse it becomes and you will lose control.
Several weeks after completion of the project, if the graph looks intact, results are sustained.
Example: Comparing before and after

A list of potential tools to use to improve accuracy % reported by the client
Different projects may need different
Tools – How to define a problem?
-
SIPOC.
-
Project charter.
-
Pareto diagram.
-
Histogram.
-
Prioritization matrices.
-
VOC (Voice of Customer analysis).
-
SWOT analysis.
Tools – How to measure the current state?
-
SIIPOOC.
-
Process mapping.
-
Flow chart.
-
Current State Value Stream Map.
-
Cause and effect diagram.
-
Cause and effect matrix.
-
Types of data.
-
Check sheet and stratification.
-
Measurement System Analysis.
-
Normal probability distribution.
-
Binomial probability distribution.
-
Poisson probability distribution.
-
Process capability analysis.
-
Box and whisker plots.
Tools – How to analyze for root causes?
-
Fault tree diagram.
-
Five why analysis.
-
Scatter diagram.
-
Simple linear correlation analysis.
-
Simple linear Regression analysis.
-
Multi-vari analysis.
-
Confidence interval estimation.
-
Eight types of waste.
-
Concepts of TAKT, cycle time, balance, and flow.
Tools – How to improve the accuracy %?
-
Planning and designing experiments.
-
One factor at a time experiment.
-
Two factors at a time experiment.
-
Poka yoke.
-
Andon.
-
Jidoka.
-
Kaizen approach.
Tools – How to sustain the gains?
-
Control charts.
-
Control plan.
-
Standard operating procedure.
-
PDCA cycle.
About the Author
Sreedher Kadambi serves as the Principal Consultant and Managing Director at Skil Global Business Solutions Private Limited. With over two decades of experience, he specializes in consulting for Operations Excellence practices within the industry. Kadambi has collaborated with over 20 diverse business segments across India, the USA, and the Middle East, catering to small, medium, large-scale enterprises, as well as multinational companies. Additionally, he holds a position as a visiting faculty member at the Indian Institute of Management, Udaipur.
Kadambi has contributed to the field by authoring numerous articles and case studies focused on the implementation of world-class operational excellence practices, available, under blog section, on www.skilglobal.com. He is also the author of "Cracking the Six Sigma Black Belt Exam," a publication by McGraw Hill, which is currently out of print.